Statistics
The Statistics graph displays the visits to your site for the selected date range displayed at the top of the graph. You can choose the date range from 1, 7, 30, or 90 days. If the displayed data seems outdated, click the Refresh Data button to update it.
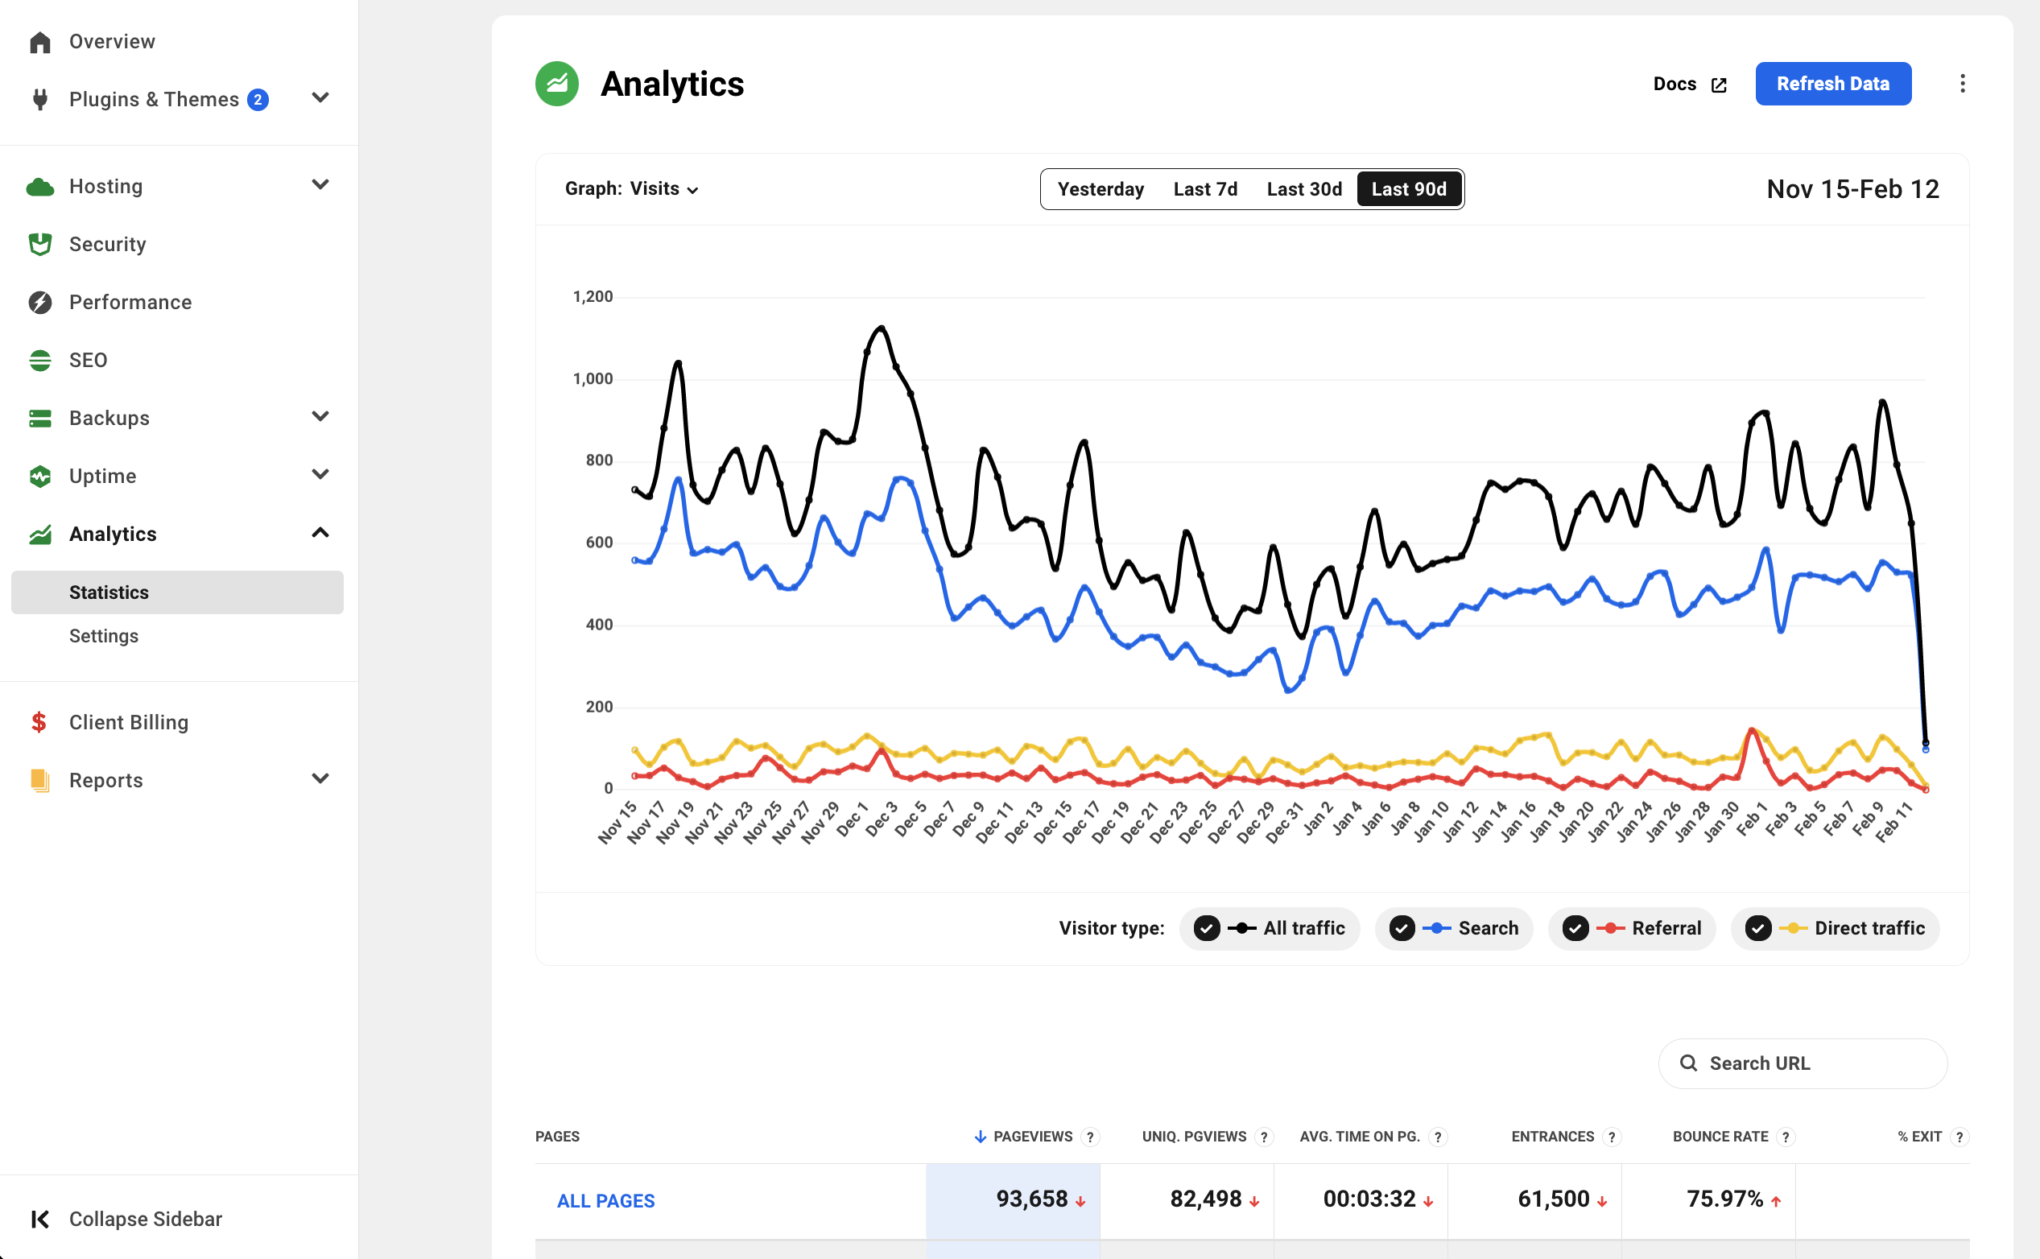
To switch between displaying the total visits and unique visitors, click the Graph dropdown in the top-left corner of the graph.
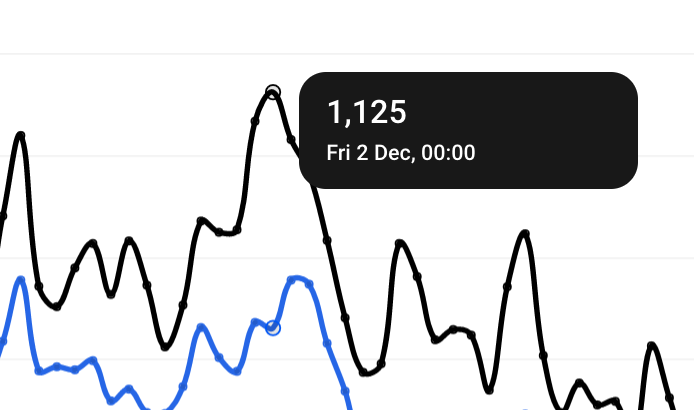
Hovering over a point in the graph lets you view the day’s total visits based on the selected visitor type.
At the bottom of the graph, you can filter the display to show All traffic, Search traffic, Referral traffic, or Direct traffic.
Page Details
The Page Details section under the graph shows all site pages visited during the selected date range. The colour-coded arrows indicate if there was an increase or decrease in the metric. The percentage below each metric shows the increase or decrease in performance compared to the same prior period.
The list initially shows only the top ten results, but you can view more by clicking the Show More button at the bottom-right of the section. To search for statistics for specific pages, type the page name in the Search box at the top-right of the section, and the list will be updated dynamically to show only the pages that match the search term.
The pages are listed in descending order based on Pageviews by default. To switch to ascending order, click the Pageviews column header. To order the pages based on any other displayed metric, click the appropriate column header, and the selected column will be highlighted in blue.
To view your website analytics on your A-Z+ Hub, log in here.
